Securitas AB
Callouts Insight: turning raw data into operational decisions
Ops teams could see raw callout totals but couldn't tell where to act. I designed the KPI and reporting layer that turned fragmented data into a decision-ready view across 50+ markets.
- Role
- Senior UX Designer, Product & Strategy
- When
- Aug 2024 – Mar 2026
- Also on Behance
- Original deck ↗
Want to ask about this project?
AI answers grounded in Anshula's CV and portfolio.
- Platform
- Operational Insights Dashboard
- Industry
- Security Logistics
- Role
- Senior UX Designer
- Timeline
- Aug 2024 – Mar 2026
tl;dr
The 10-second version
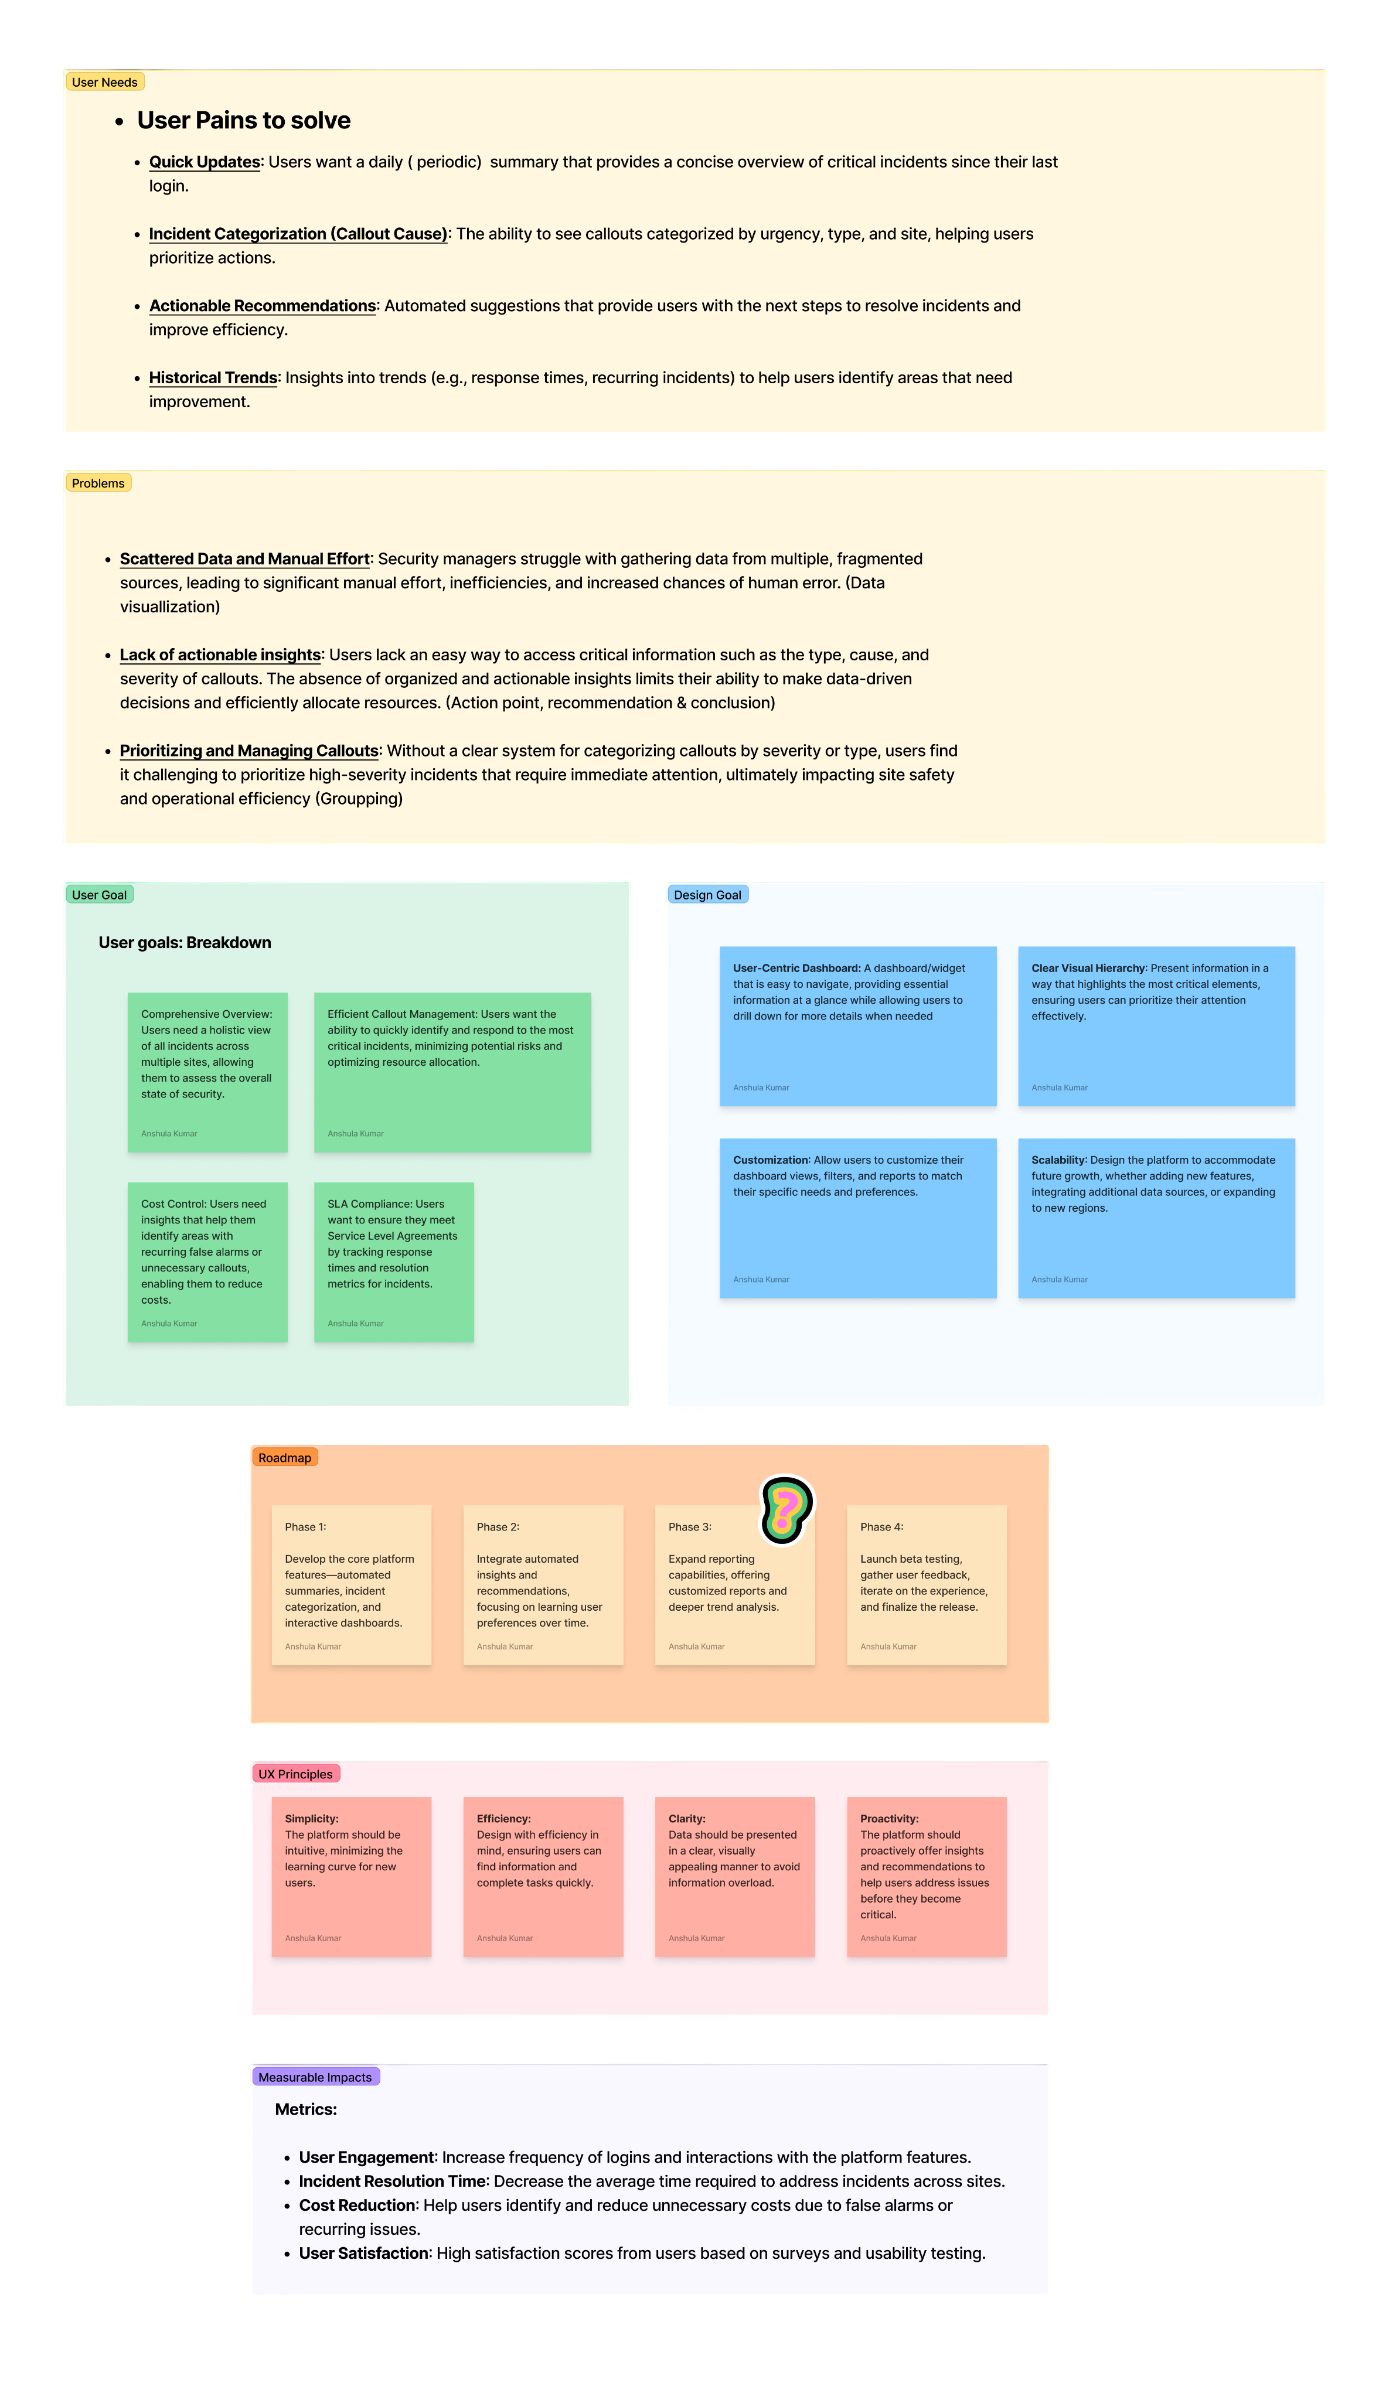
Securitas ops teams could see raw callout totals but couldn't tell where to act. In roughly three months, working within fragmented legacy data across 50+ markets, I led the research and design of a KPI and reporting layer that turned that raw data into a decision-ready view, shipping a validated Phase 1 first and navigating a real finance-vs-operations tension over how cancelled callouts were counted. It moved teams from reactive firefighting to proactive service management.
- 40% less time spent analysing performance, as visual summaries replaced manual report digging.
- 25% faster to catch delayed responses, via SLA-benchmarked response-time buckets.
- Live across 50+ markets and referenced in 200+ client review sessions as the shared SLA source of truth.
01
Context
Securitas is one of the world's largest private security companies, providing guarding, alarm response, and mobile services across 50+ markets. Clients needed more than raw data. They needed actionable insight into when, why, and how security incidents were managed.
Callouts, triggered by alarms or urgent needs, required rapid guard dispatch but offered clients little visibility into response times, outcomes, or escalations. The goal was an intuitive solution enabling transparent monitoring of field performance, insight into callout volumes and response efficiency, and stronger control over service validation, risk, and SLA compliance.
02
Reframing visibility in field operations
Clients needed better visibility into the callouts process: why callouts happen, their severity, and trends over time, so they could take the right operational or financial action. Users faced key limitations:
- Hard to access trends: data existed in reports, but insights had to be dug out manually.
- No instant overview: no way to assess efficiency, SLA compliance, or recurring issues at a glance.
- Limited predictive insight: demand and staffing remained reactive.
“We can see totals, but we don't know where to take action.”
Regional Ops Lead
03
Research and insights
I used a blend of qualitative research and operational analysis to uncover pain points and expectations: workshops with client operations and dispatch teams, analysis of feedback from the existing summary dashboard, and a full audit of the callouts lifecycle. Partnering with business analysts, I mapped gaps in SLA enforcement and visibility.
04
Strategy and approach
I took a product-thinking approach anchored in design sprints, improving short-term clarity while laying the groundwork for long-term intelligence. I chose a phased release over a monolithic dashboard, which let us test, learn, and iterate faster:
- Progressive levels of data granularity (summary to detail).
- Status signals, SLA breakdowns, and site performance made easy to scan.
- Consistency with the wider insights platform.
- Phase 1 as a high-level KPI view, followed by Phase 2 for detailed drill-downs.
Key decision · Phased release over a monolithic dashboard
- The tension
- Client and ops leadership wanted a single comprehensive dashboard matching the full scope promised early on. But the callout data lived in fragmented legacy systems across 50+ markets with no shared schema, and I had roughly three months, not enough to build the complete vision responsibly.
- What I decided
- I proposed a phased release instead: ship a high-level KPI view first, validate it with real usage inside the three-month window, then add detailed drill-downs in phase two. A fast, validated first version would surface hard problems, like how to handle cancelled callouts fairly, while there was still time to fix them.
- The result
- Faster validation and lower risk. Phase 1 shipped on time, real usage exposed edge cases early, and the roadmap stayed aligned to the long-term vision without over-committing upfront.
05
The solution
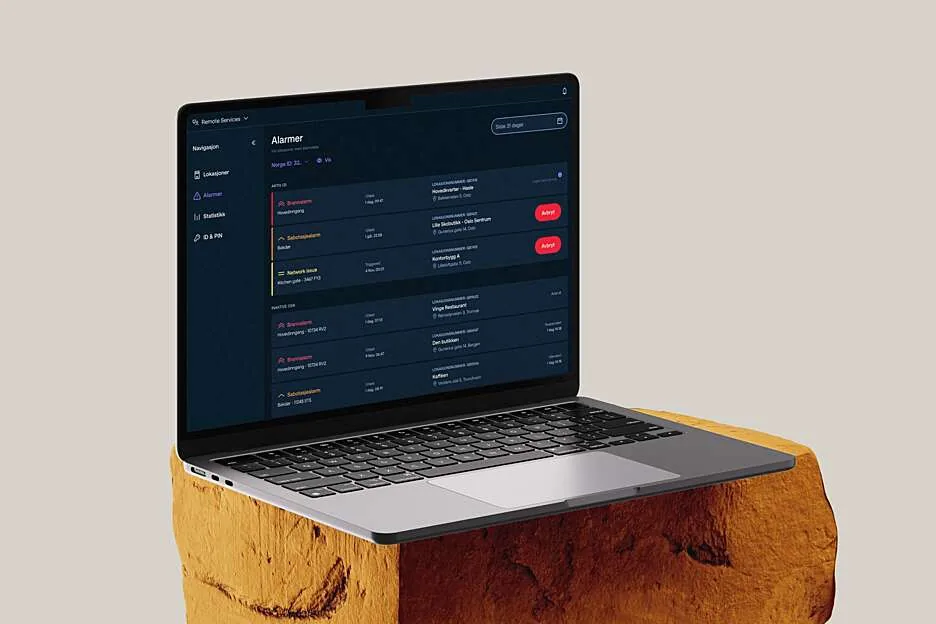
A callouts dashboard offering both immediate clarity and deeper exploration, surfacing performance issues and trends without manual analysis. Structured around core design themes: visual clarity, comparative trends, callout specificity (regular, cancelled, and escalated), and user guidance.
06
Design principles and components
Modular, actionable components for both high-level scanning and deeper analysis:
- Performance Indicator Cards: total, real, and cancelled callouts with trend deltas.
- Response Time Buckets: under 30 min, 30 to 60 min, over 60 min, benchmarked against SLA thresholds.
- Trends Graph: current vs previous period, broken down week by week.
- Segment Control: toggle between Incidents and callouts, consistent with the wider platform.
- Empty and Error States: gracefully handle partial data and clarify expectations.
Key decision · Cancelled callouts: clean signal vs. full cost visibility
- The tension
- Regional managers needed a clean performance signal they could trust, but cancelled callouts distorted response-time averages. Finance, meanwhile, needed those same cancelled callouts fully visible for cost tracking. The two needs pulled in opposite directions on a single metric.
- What I decided
- I excluded cancelled callouts from the performance averages so managers got an undistorted signal, while keeping them fully visible in a separate cost-tracking view. One dataset, two honest lenses, no hidden data.
- The result
- Regional managers got a trustworthy performance read, finance kept complete cost visibility, and the dashboard avoided the credibility trap of a metric that quietly buried inconvenient data.
07
Wireframes and interactions
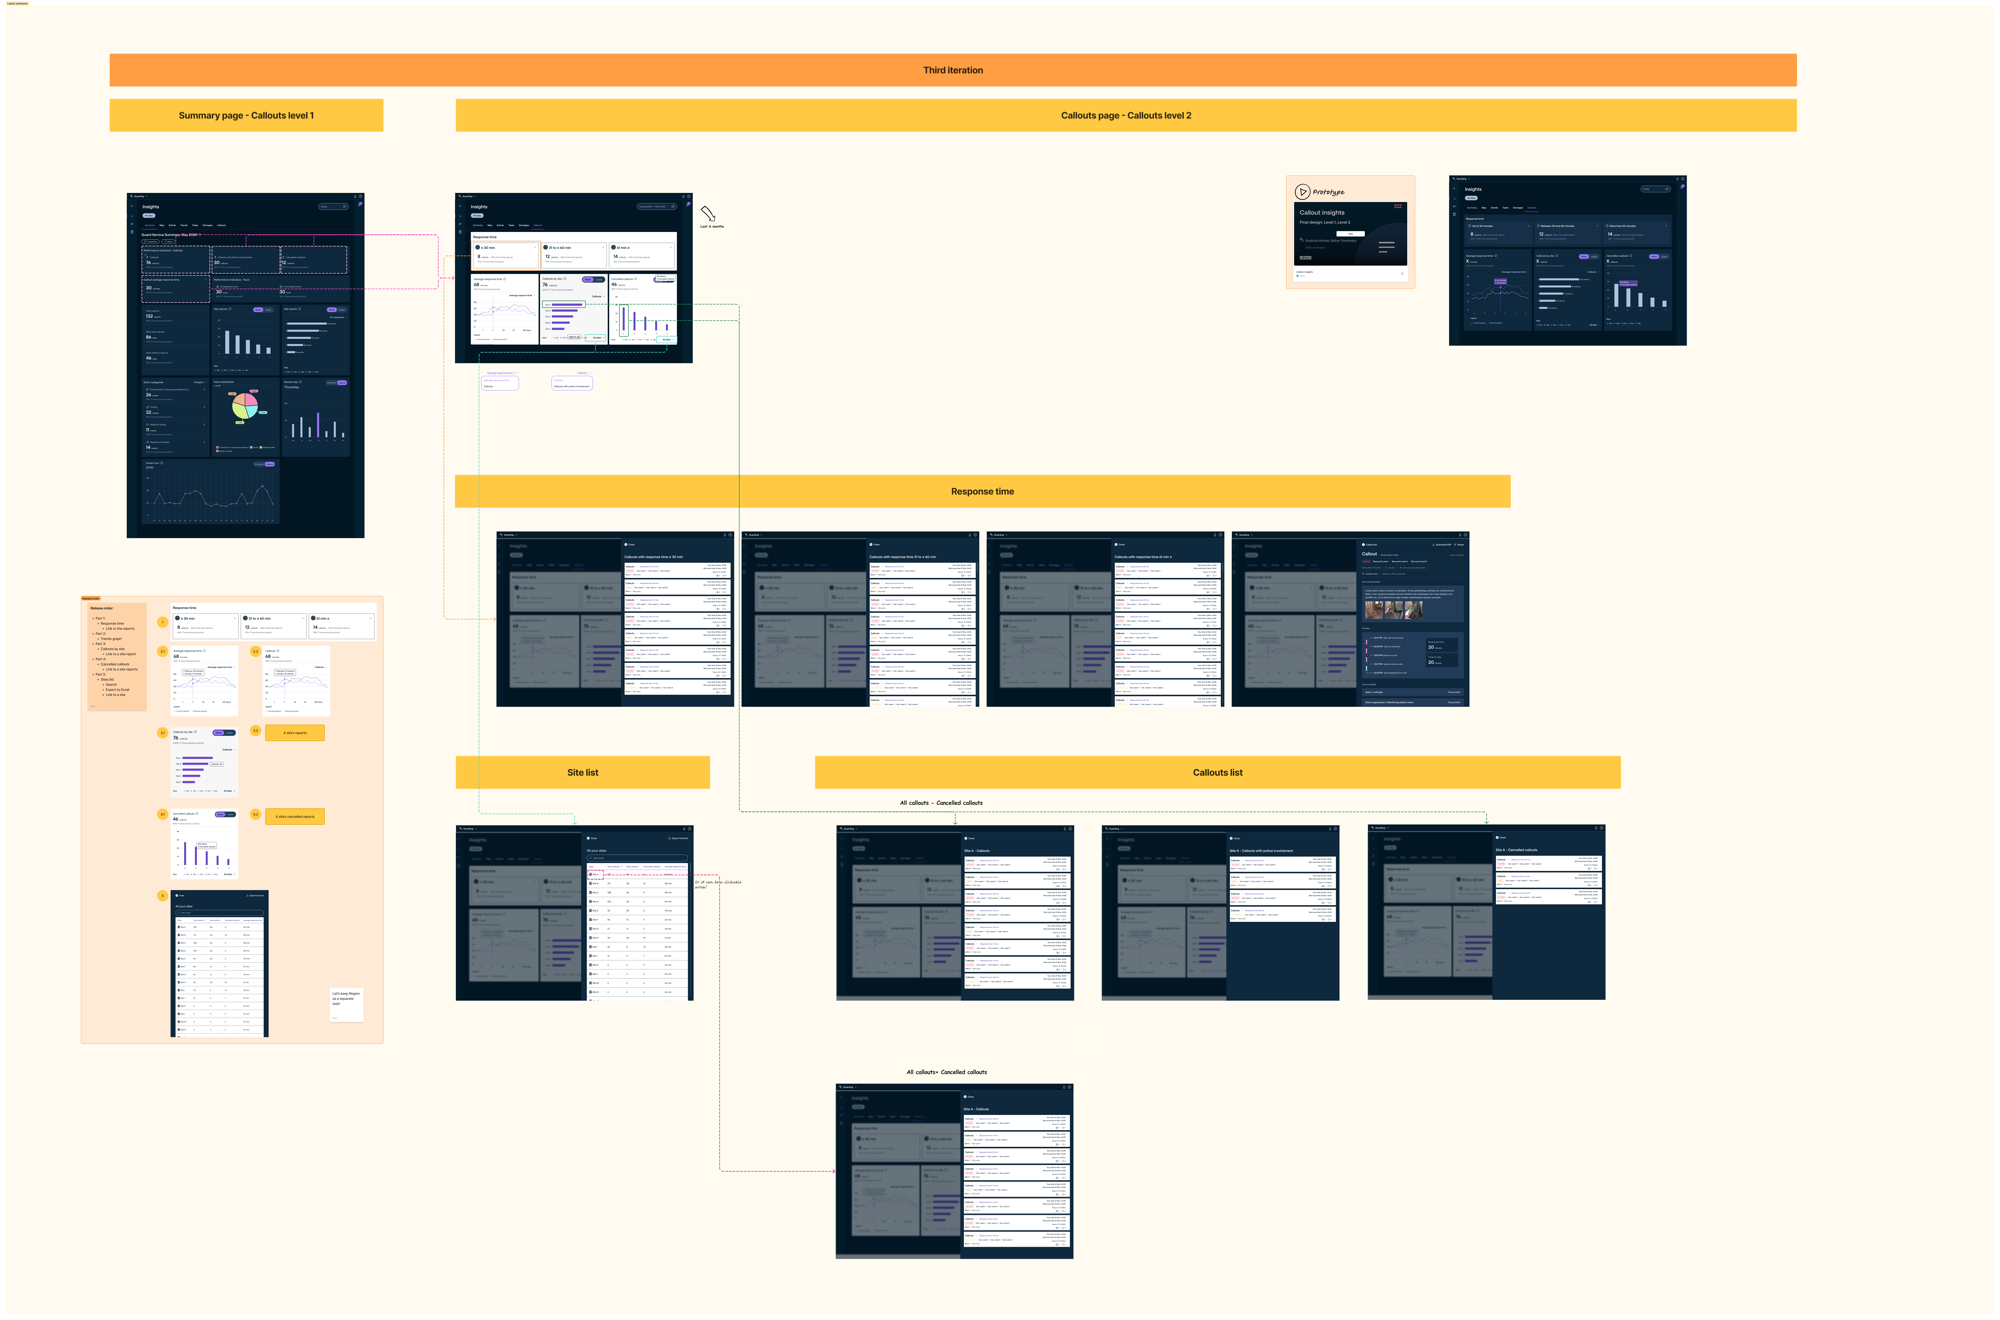
The interaction strategy aimed to build trust in real-time, data-driven decisions, translating backend complexity into intuitive, efficient interactions. Interactive trend graphs with hover insights, modular clickable SLA cards, and purposeful empty states. I worked closely with the engineering team to implement progressive data loading, allowing the UI to handle high callout volumes while remaining responsive, including fallback logic for edge cases such as partially available historical data.
08
Prototype
Explore the interactive prototype below to see how the KPI and reporting layer comes together.
Callouts Insight
Measuring success
How I defined success
Before launch, I set the signals we would track to judge whether the dashboard actually changed behaviour, not just shipped.
- Manual report dependency
- Tracking user behaviour to measure reduced reliance on raw callout reports.
- Engagement with the trend graph
- Understanding how often trend views were used to spot patterns over time.
- Cancelled callouts visibility
- Ensuring users actively reviewed and acted on cancellation trends to address false positives.
- SLA compliance
- Adoption of response time buckets as an indicator of performance alignment.
- Operational efficiency gains
- More effective staffing and resource planning based on demand visibility from callout trends.
- Faster insight-to-action cycles
- Reducing the time between identifying a problem and responding, thanks to live data access.
Result and impact
From reactive firefighting to proactive service management
Reduced Analysis Time by
Improved Alert Response by
Markets Served
UX impact
- 25% faster identification of delayed responses.
- Replaced spreadsheets with intuitive visual summaries, simplifying analysis, reducing manual effort, and helping teams spot patterns faster.
- Enabled teams to anticipate peak callout periods and respond proactively, reducing delays and improving SLA adherence.
Product & business impact
- Rolled out in 50+ global markets, creating consistency and shared visibility across regional operations.
- Used in over 200+ client review sessions to validate SLA commitments; the dashboard became a trusted reference point across regions, shifting performance conversations from reactive reporting to real-time insight delivery.
- Reduced manual report digging by 40%, freeing up operational time for strategic planning and issue resolution.
The Callouts dashboard bridged the visibility gap and turned raw data into operational intelligence, helping Securitas' clients move from reactive incident handling to proactive performance management.
09
What I learnt
- Strategic alignment matters: phased rollouts enabled faster validation without losing long-term vision.
- Facilitation is a core skill: bridging product, engineering, and operations ensured usability and feasibility.
- Clarity over complexity: simple, transparent design choices built user confidence.
- Design is never one-and-done: real-world feedback shaped meaningful improvements.
- Listening beats assumption: research surfaced mental models a top-down approach would miss.
Conclusion
The Callouts Insight dashboard marked a fundamental shift in how Securitas tracks, manages, and communicates field performance. By replacing fragmented reports with real-time, insight-driven tools, we enabled faster decisions, more confident client conversations, and stronger SLA accountability across 50+ markets, turning information into impact.
Want to talk through this kind of work? Get in touch.
More work